Bellwoods Centres for Community Living is a community-based organization dedicated to advancing independence for people with physical disabilities.
We believe independent living is a right, not a privilege. People are strongest when they are supported to make decisions about their own lives.
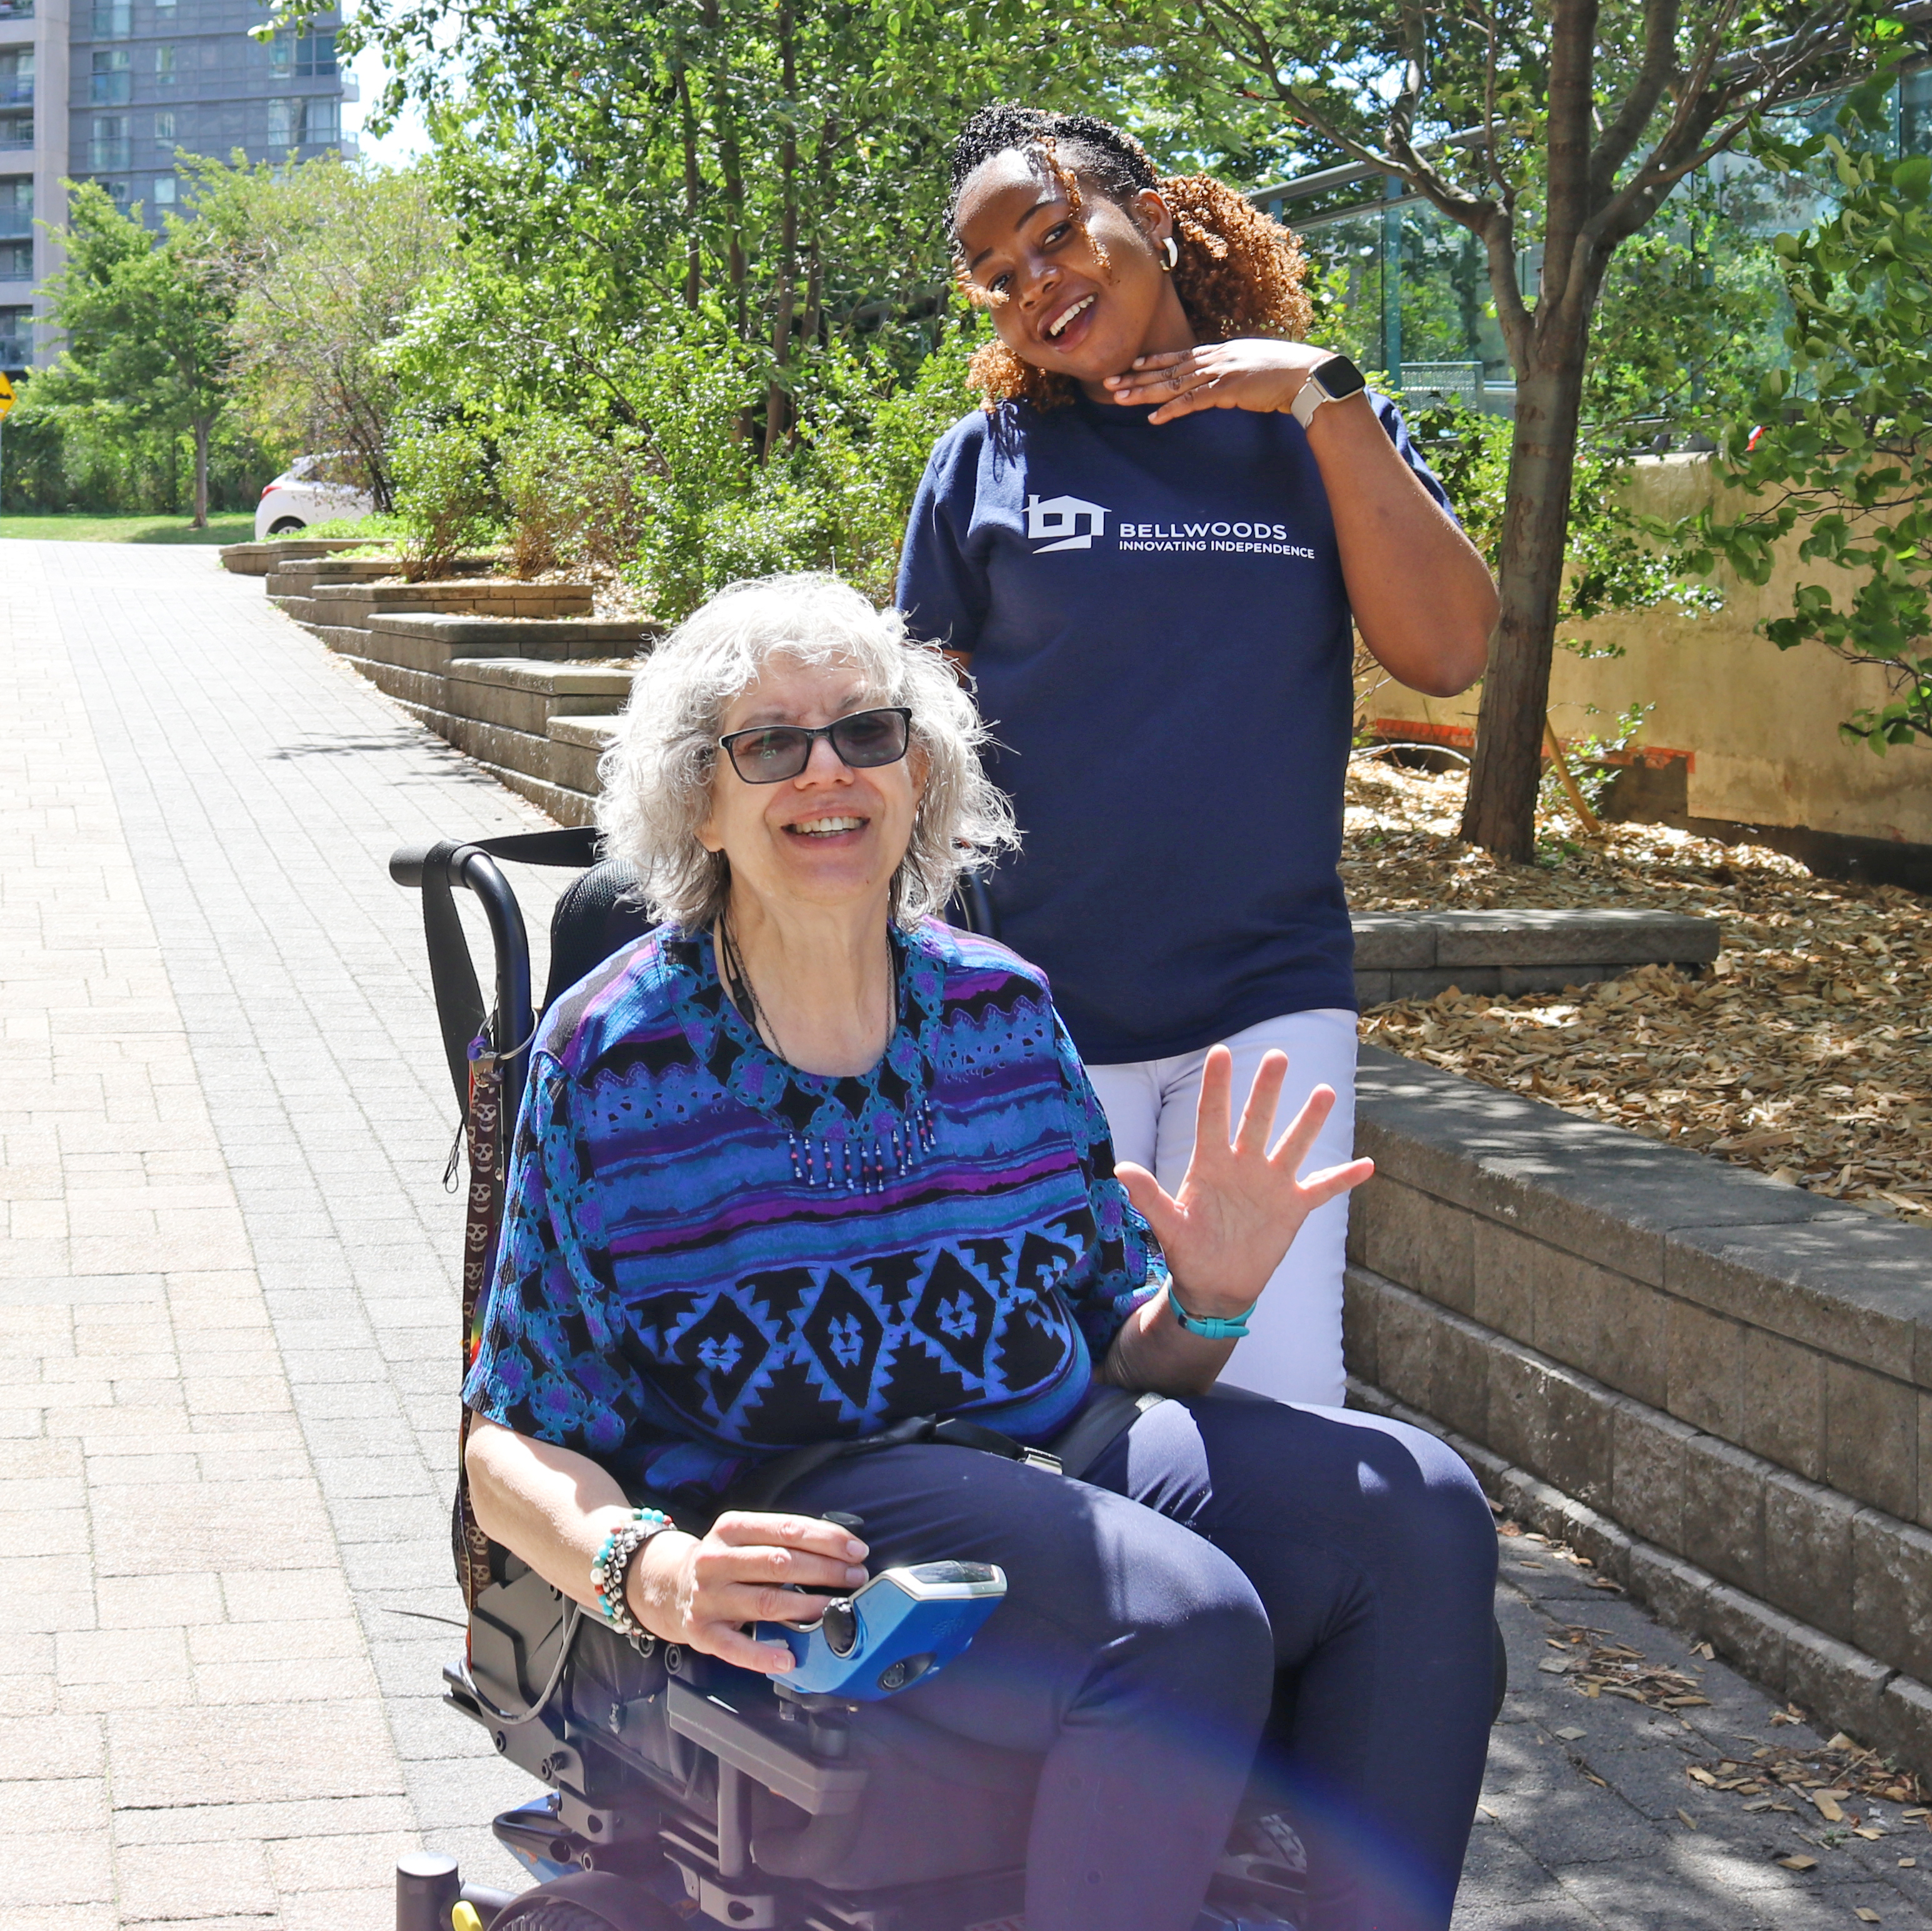
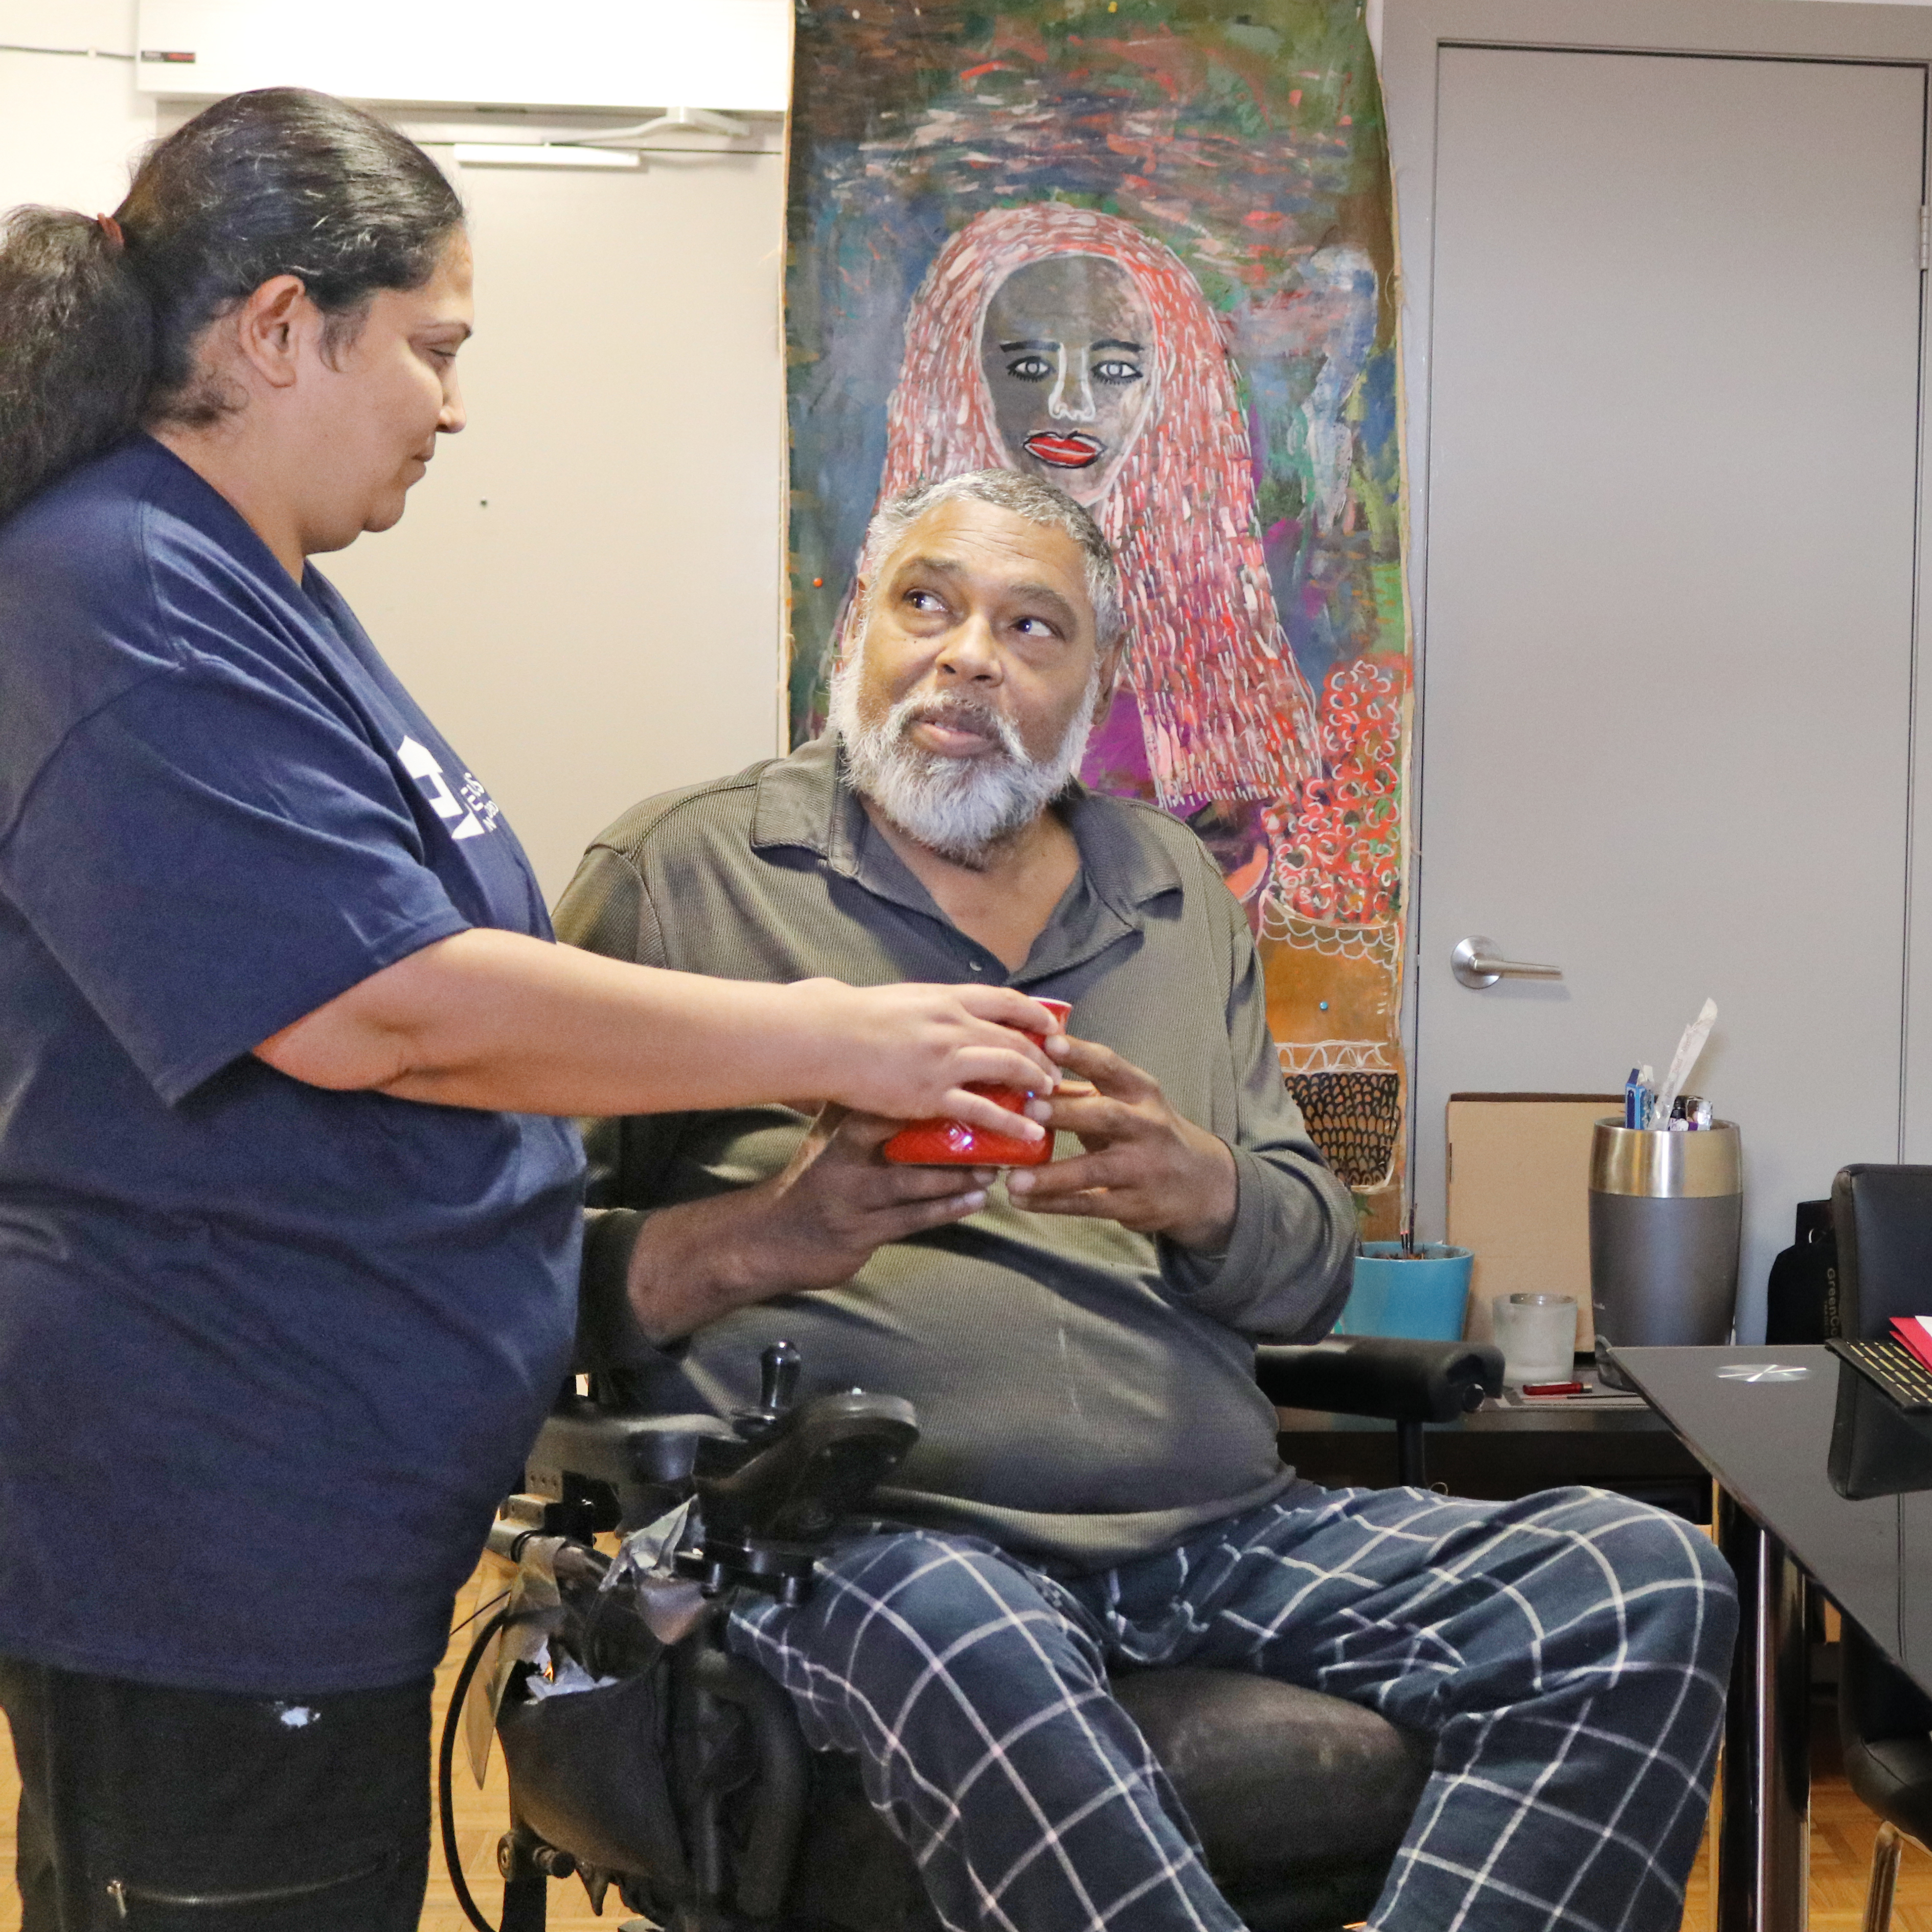
Advancing independence for people with physical disabilities through personal support, accessible housing, and inclusive communities.
A future where independent living is attainable for everyone.
Our Values
» Client & family-centred care
» High-quality programs
» Strong partnerships
» Performance excellence
» Valued, supported staff
Who We Serve
Bellwoods supports adults with physical disabilities who require personal support to live independently in the community. We work alongside people with diverse needs and life experiences, tailoring our services to reflect what matters most to each individual.
Our Commitment to Equity, Diversity & Inclusion
Accessibility is foundational to who we are. It informs how we design our housing, deliver services, and communicate with the community. We are committed to:
Removing physical, social, and systemic barriers.
Designing environments and services that support meaningful access.
Listening to and learning from the people we support.
Continuously improving our practice through feedback and accountability.
This commitment extends across our housing services, communications, and organizational governance.